Suppose we have a wire
![]() feet long whose density is
feet long whose density is
![]() pounds per foot at the point
pounds per foot at the point
![]() feet from the left hand end of the wire. What is the total mass of the wire and where is its
center of mass
, i.e., the point cm about which the total moment of the wire is 0?
feet from the left hand end of the wire. What is the total mass of the wire and where is its
center of mass
, i.e., the point cm about which the total moment of the wire is 0?
![Sum(rho(c[i])*Delta*x[i],i = 1 .. n)](images/cmass7.gif) . This approximate mass is a
Riemann sum
approximating the integral
. This approximate mass is a
Riemann sum
approximating the integral
 , and so the mass of the wire is defined as the value of this integral.
![Sum((c[i]-cm)*rho(c[i])*Delta*x[i],i = 1 .. n)](images/cmass10.gif) . This is seen to be a Riemann sum approximating the integral
. This is seen to be a Riemann sum approximating the integral
 . But the center of mass is defined as the point about which the total moment is zero so the integral satisfies the equation
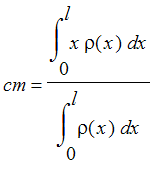
 . Using properties of integrals, we can solve this equation for cm, to get the ratio of integrals
 . Note the top integral represents the total moment of the wire about its left end (x=0) and the bottom integral is the total mass of the wire.
Exercise: Find the center of mass of a wire 1 foot long whose density at a point x inches from the left end is 10 + x + sin(x) lbs/inch.
Center of mass of a solid of revolution
If
![]() for
for
![]() , then let S be the
solid of revolution
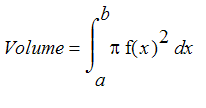
obtained by rotating the region under the graph of f around the x axis. We know how to express the volume of S as an integral: Just integrate from a to b the crossectional area
, then let S be the
solid of revolution
obtained by rotating the region under the graph of f around the x axis. We know how to express the volume of S as an integral: Just integrate from a to b the crossectional area
 of the solid S to get

Now how would we find the
center of mass
of the solid, assuming it's made of a homogeneous material? Well, it's clear that the center of mass will be somewhere along the x-axis between a and b. Let CM be the center of mass. Partition
![]() into n subintervals
into n subintervals
![]() and using planes perpendicular to
and using planes perpendicular to
![]() approximate the solid S with the n disks where the ith one has volume
approximate the solid S with the n disks where the ith one has volume
![]()
Now the signed moment of the ith disk about the point CM is
![]() and the sum of these moments will be approximately 0, since CM is the center of mass. If we let
and the sum of these moments will be approximately 0, since CM is the center of mass. If we let
![]() go to zero this approximate equation becomes an equation for the center of mass:
go to zero this approximate equation becomes an equation for the center of mass:
| > | CMequation := int((x-CM)*Pi*f(x)^2,x=a..b) =0; |

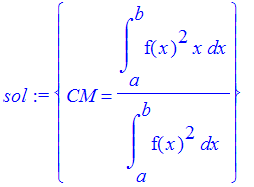
Useing properties of integrals, we can solve this equation for CM.
| > | sol := solve(CMequation,{CM} ) ; |

Notice that the center of mass of the solid of revolution is the same as the center of mass of a wire whose density at
![]() is the area of the cross-section.
is the area of the cross-section.
We can define a word cenmass which takes a function f, an interval [a,b], and locates the center of the solid of revolution.
| > | cenmass := proc(f,a,b) int(x*f(x)^2,x=a..b)/int(f(x)^2,x=a..b) end: |
For example, the center of the solid obtained by rotating the region R under the graph of
![]() for x between 0 and
for x between 0 and
![]() is
is
| > | cenmass(cos,0,Pi/2); |

Now we can define a word to draw the solid and locate the center of mass.
| > | drawit := proc(f,a,b) local cm, solid; ### WARNING: the definition of the type `symbol` has changed'; see help page for details cm := plots[pointplot3d]([evalf(cenmass(f,a,b)),0,0],color=red,symbol=box,thickness=3): solid := plots[tubeplot]([x,0,0],x=a..b,radius=f(x),numpoints=20,style=wireframe); plots[display]([cm,solid],scaling=constrained); end: |
Test this out.
| > | drawit(cos+2,0,7); |
![[Maple Plot]](images/cmass30.gif)
We can animate the motion of the center of mass as the solid changes.
| > | plots[display]([seq(drawit(2+cos,0,t),t=1..10)], insequence=true); |
Exercise: Find the center of mass of a homogeneous hemispherical solid.
Exercise: A homogeneous solid is in the shape of a parabolic solid of revolution obtained by rotating the graph of y = x^2 , x in [0,a] around the the y axis, for some positive number a. If the center of mass is at y= 10, what's a?