The 4-D Measure Polytope
The Hypercube
Michael Haney
These are the procedures necessary to generate the various images of the hypercube. In order to keep the text uninterupted, placing the cursor on the first line of commands (in red) will execute all procedures necessary to define the polytope. Maple will then take you to the first line of the next execution group. You may need to scroll back to read the text which precedes each display.
These are the libraries of commands needed to execute the procedures below.
> with(linalg):with(plots):
Project is a procedure which takes a polytope P and a vector v and projects the vertices of P onto the hyperplane orthogonal to v .
>
project:=proc(P,v) local a,b,c,d,n,i;
a:=v[1];b:=v[2];c:=v[3];d:=v[4];
n:=sqrt(a^2+b^2+c^2+d^2);
[[seq([(P[1][i][1]*d+P[1][i][2]*c-P[1][i][3]*b- P[1][i][4]*a)/n,
(-P[1][i][1]*c+P[1][i][2]*d+P[1][i][3]*a- P[1][i][4]*b)/n,
(P[1][i][1]*b-P[1][i][2]*a+P[1][i][3]*d- P[1][i][4]*c)/n],
i=1..nops(P[1]))],P[2],P[3]];
end:
Perspproj is a procedure which takes a polytope P, a vector v , and a real number f , and projects the vertices of P onto the hyperplane orthogonal to v , with a perspective distance factor of f . For large values of f , the object will be perspected as if it were viewed from far away (though no smaller). Thus, the effects of perspective will be minimal. Smaller values of f will generate a greater perspective effect in the projection. Values must be greater than 1, and this often results in a division by 0. Other values may create the same problem.
>
perspproj:=proc(P,v,f) local a,b,c,d,n,i,p1,p2,p3,p4,g,q1,q2,q3,q4;
a:=v[1];b:=v[2];c:=v[3];d:=v[4];
n:=sqrt(a^2+b^2+c^2+d^2);
for i from 1 to nops(P[1]) do;
p1:=P[1][i][1];p2:=P[1][i][2];
p3:=P[1][i][3];p4:=P[1][i][4];
p1:=p1-f*a/n;p2:=p2-f*b/n;
p3:=p3-f*c/n;p4:=p4-f*d/n;
g:=-n*f/(a*p1+b*p2+c*p3+d*p4);
q1[i]:=g*p1;q2[i]:=g*p2;q3[i]:=g*p3;q4[i]:=g*p4;
od;
[[seq([(q1[i]*d+q2[i]*c-q3[i]*b-q4[i]*a)/n,
(-q1[i]*c+q2[i]*d+q3[i]*a-q4[i]*b)/n,
(q1[i]*b-q2[i]*a+q3[i]*d-q4[i]*c)/n],
i=1..nops(P[1]))],P[2],P[3]];
end:
Polydecode is a procedure which takes a polytope P and lists the coordinates of the vertices of each polygonal face. This defines the polytope by its faces, allowing polygonplot3D to display it.
>
polydecode:=proc(P) local i,j;
[seq([seq(P[1][P[2][i][j]],j=1..nops(P[2][i]))],
i=1..nops(P[2]))];
end:
Multpoly is a procedure which take a polytope P and a rotation matrix M and multiplies each of the vertices (thought of as column matrices) by M, generating a rotation about some vector v .
>
multpoly:=proc(P,M) local i;
[[seq([M[1,1]*P[1][i][1]+M[1,2]*P[1][i][2]+M[1,3]*P[1][i][3]+M[1,4]*P[1][i][4],
M[2,1]*P[1][i][1]+M[2,2]*P[1][i][2]+M[2,3]*P[1][i][3]+M[2,4]*P[1][i][4],
M[3,1]*P[1][i][1]+M[3,2]*P[1][i][2]+M[3,3]*P[1][i][3]+M[3,4]*P[1][i][4],
M[4,1]*P[1][i][1]+M[4,2]*P[1][i][2]+M[4,3]*P[1][i][3]+M[4,4]*P[1][i][4]],
i=1..nops(P[1]))],P[2],P[3]];
end:
The 16 vertices of the hypercube:
>
p[1]:=[-1,-1,-1,-1]: p[2]:=[1,-1,-1,-1]:
p[3]:=[-1,1,-1,-1]: p[4]:=[1,1,-1,-1]:
p[5]:=[-1,-1,1,-1]: p[6]:=[1,-1,1,-1]:
p[7]:=[-1,1,1,-1]: p[8]:=[1,1,1,-1]:
p[9]:=[-1,-1,-1,1]: p[10]:=[1,-1,-1,1]:
p[11]:=[-1,1,-1,1]: p[12]:=[1,1,-1,1]:
p[13]:=[-1,-1,1,1]: p[14]:=[1,-1,1,1]:
p[15]:=[-1,1,1,1]: p[16]:=[1,1,1,1]:
The 24 polygons of the hypercube are each squares. They are given by their vertices.
>
f[1]:=[1,5,13,9]: f[2]:=[2,6,14,10]:
f[3]:=[3,7,15,11]: f[4]:=[4,8,16,12]:
f[5]:=[1,3,11,9]: f[6]:=[2,4,12,10]:
f[7]:=[5,7,15,13]: f[8]:=[6,8,16,14]:
f[9]:=[1,2,10,9]: f[10]:=[3,4,12,11]:
f[11]:=[5,6,14,13]: f[12]:=[7,8,16,15]:
f[13]:=[1,3,7,5]: f[14]:=[2,4,8,6]:
f[15]:=[9,11,15,13]: f[16]:=[10,12,16,14]:
f[17]:=[1,2,6,5]: f[18]:=[3,4,8,7]:
f[19]:=[9,10,14,13]: f[20]:=[11,12,16,15]:
f[21]:=[1,2,4,3]: f[22]:=[5,6,8,7]:
f[23]:=[9,10,12,11]: f[24]:=[13,14,16,15]:
The eight cells of the hypercube are each cubes. They are given by their polygons.
>
c[1]:=[1,3,5,7,13,15]:
c[2]:=[2,3,6,8,14,16]:
c[3]:=[1,2,9,11,17,19]:
c[4]:=[3,4,10,12,18,20]:
c[5]:=[5,6,9,10,21,23]:
c[6]:=[7,8,11,12,22,24]:
c[7]:=[13,14,17,18,21,22]:
c[8]:=[15,16,19,20,23,24]:
The data structure used for the 4-polytope is a list of a list of vertices, whose coordinates are defined above, a list of polygons given by the number of their vertices, and a list of cells given by the number of their polygons. The list structure is: [[vertices],[polygons],[cells]].
> hypercube:=[[seq(p[i],i=1..16)],[seq(f[i],i=1..24)],[seq(c[i],i=1..8)]]:
The Hypercube
Existence
The so-called hypercube, or 4-cube, is undoubtedly the most familiar and frequently discussed polytope in a higher dimension. It has even made its way into popular fiction in one form or another. In one piece, an architect builds a house which folds up into 4-space, so that its occupants can continuously walk in any direction from one room into each of the other seven. Perhaps its popularity is due to the easy regularity with which it is constructed. Though a simplex is, as the name suggests, a simpler polytope, it is the measure polytope with which we generally feel most comfortable.
The reason this type of polytope is referred to as a "measure" is this: it is the unit in each space in which we measure. The measure polytope in a line is a line-segment, which is the same as its simplex. (1-space is a rather boring topic of discussion, but is included for consistency.) In 1-space, we measure content in terms of length. The measure of any region of the line can be expressed as a real number times the unit length, that is, the measure polytope of side-length 1.
In 2-space, the measure polytope is a square. You can think of generating it by first moving a point one unit in one of the base directions (say, along the x-axis), then turning perpindicular to it and sliding the whole line segment one unit in the orthogonal base direction (the y-axis). This sweeps out a square of side-length 1, with which we measure area.
Sliding the square one unit in a direction perpendicular to its face sweeps out a cube, the measure polyhedron. We speak of volume as being in cubic units (e.g.,
![]() ). Just as line-segments can be placed end-to-end to fill 1-space, and squares can be laid edge-to-edge to fill the plane, cubes can be placed together neatly to fill all of 3-space. (This is the reason bricks are shaped the way they are.)
). Just as line-segments can be placed end-to-end to fill 1-space, and squares can be laid edge-to-edge to fill the plane, cubes can be placed together neatly to fill all of 3-space. (This is the reason bricks are shaped the way they are.)
If we look at the vertex of any measure polytope, we see an edge coming from it parallel to each of the orthogonal bases of the vector-space. There are two perpendicular edges meeting at each corner of the square, and three perpendicular edges meeting at each corner of the cube. If we take a unit cube, and slide it in a direction perpendicular to all six faces, we would generate the measure polytope for 4-space, having four edges meet at a vertex, each perpendicular to the other three. This polytope is the famous hypercube.
Furthermore, since n-space is defined by n orthogonal bases, it should be clear that one can construct a polytope with n edges meeting at a vertex, each parallel to a base, and so each perpendicular to one another. With this sort of argument, we can prove more rigorously that there is a measure polytope which exists in every dimension.
Structure
The construction of the hypercube is usually best thought of in the terms mentioned above. First a vertex sweeps out a line. That line then sweeps out a plane. When it does so, each of the vertices sweeps out another line. So the four sides of a square come from the starting and stopping point of the line, and the two lines created by its end-points.
When a square sweeps out a cube, each of the four corners of the square sweeps out new lines, which become four additional edges. Each edge of the cube sweeps out a new square. So the six faces of the cube come from the starting and stopping points of the original square, plus the four faces swept out by its edges. The 12 edges come from the 8 edges of the initial and final square, plus the four edges generated by the four corners of the square. The number of vertices is again doubled, so that a cube has eight.
Now, when we think of this cube moving perpendicular to itself, we are thinking of a direction orthogonal to all the faces of the cube. We certainly can't point in that direction. But we should be able to see that the cube will have a starting and stopping point, which are two of the cubic cells of the hypercube. Also, we should see that each of the six faces of the cube will sweep out cubes. So the hypercube consists of eight cubes in all. The 12 edges sweep out 12 new faces. These, together with the 12 faces of the first and last cube, total 24 in the hypercube. There is one new edge for each corner of the cube, plus 12 edges in the first cube and 12 edges in the last comes to 24. And again, the vertices are doubled, so that a hypercube has 16.
Schl�fli Symbol
The Schl�fli symbol of the measure polytope in 2-space, the square, is {4}. The next order measure polytope is generated by folding three of these squares about a point. So the symbol for the cube is {4,3}. Just as four squares about a point lie in a plane, four cubes about an edge lie in a hyperplane. We form the hypercube in roughly the same way we form the cube: by removing one of the cubes about the edge and folding the other three. Hence, the symbol for the hypercube is {4,3,3}.
As we can now tell from the symbol, the vertex figure of the hypercube is a tetrahedron. Just as the vertex figure of the 3-measure is a 2-simplex, the vertex figure of the 4-measure is a 3-simplex. Likewise, the vertex figure of the n-measure will be a (n-1)-simplex. So the symbols for all the measure polytopes have a first number 4 and the rest of the entries are 3's.
Also, the dual of {4,3,3} is the polytope represented by {3,3,4}. This is the so-called hyperoctahedron, which we discuss in the next section.
Coordinates
In order to generate ordered quadruples of coordinates for the hypercube, it helps to understand how we might find the coordinates of other measures. In a line, the endpoints can simply be expressed by any two numbers, so let's say (1) and (-1). In the plane, we can think of connecting a point from each quadrant. Thus, the ordered pairs for the vertices of a square look like combinations of 1 and -1. These possible combinations are called permutations. The corners look like (1,1), (1,-1), (-1,1) and (-1,-1).
Moving to the cube, we can think of sliding the square in the xy-plane down to z = -1 and up to z = 1. Thus, the coordinates of the cube are the permutations of (�1,�1,�1). From this, we can see that the coordinates for the corners of a hypercube should come from permuting (�1,�1,�1,�1) and there are, in fact, 16 possibilities. Now we can easily induce that the coordinates for any n-measure polytope (with sidelenght 2) can be found by permuting n �1's.
Here is a projected image of the hypercube. Its cells can be easily distinguished as cubes if you imagine that the cubes are slightly slanted. That is, the angles are distorted. You can change the projection vector to generate different images.
>
polygonplot3d(polydecode(project(hypercube,[1,3,4,2])),scaling=constrained,style=wireframe,thickness=2);
![[Maple Plot]](images/haneyhypercube2.gif)
Maple can display a series of images from different points of view by varying the projection vector. The sequence below in generated by looking at the hypercube from the direction of (1,0,0,0), varying it to (1,1,1,1) and back again. Notice that because the initial projection is along an axis, we are looking directly at one of the cubic cells, so it completly covers the others. (Six of them are hidden by the sides of the cube, and the seventh is directly behind the one we see.) As the view changes, the other cells become visible.
>
display([seq(polygonplot3d(polydecode(project(hypercube,[1,evalf(sin(Pi*k/40),2),evalf(sin(Pi*k/40),2),evalf(sin(Pi*k/40),2)]))),k=0..40)],insequence=true,thickness=2,scaling=constrained,style=wireframe);
![[Maple Plot]](images/haneyhypercube3.gif)
Here is a traditional perspective projection of the hypercube. This is the image most people associate with it, though they may not understand it. If you imagine looking at a large cube very close to your face, what would the image be? The front face would be a large square, and you could see all of the other edges and vertices inside this square. The back square would be smaller, and its corners would be joined to the corners of the front face. Thus, the top, bottom, and side squares would appear to be trapezoids.
The image below is an analogy to this sort of view. Imagine viewing the hypercube very close to one of its cubic cells. Then you would see the "front" cube as large and containing the rest of the object. The "back" cube would be smaller and in the middle, and its corners would be connected to the corners of the front cube. The six cells in between appear as truncated pyraminds, just as the sides of the perspective cube appear as "truncated" triangles. There is a cubic cell on top, bottom, front, back, left, and right, which are each distorted in this way. So in all, the display below shows us eight cubes (not just two).
In terms of the construction of the hypercube as sweeping a cube through 4-space, this view shows a cube which has been swept outward in every direction. This of course is indistinguishable from the sides of the cube being swept inward.
>
polygonplot3d(polydecode(perspproj(hypercube,[1,0,0,0],3)),
scaling=constrained,style=wireframe,thickness=3);
![[Maple Plot]](images/haneyhypercube4.gif)
Now we can generate a series of images by looking at the hypercube from one perspective point of view and rotating the hypercube about a plane. This is done by multiplying each of its vertices by a rotation matrix, discussed to some extent in the text.
The images show the shadow of the hypercube changing in a way that brings the bottom cell to the "back" position in the center, this cell to the top, and the top one inverts and comes down around the outside. Notice that the four cells around the sides are simply rotating as we would expect regular cubes to rotate.
>
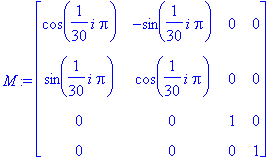
i:='i':t:=i*Pi/30:
M:=array([[cos(t),-sin(t),0,0],[sin(t),cos(t),0,0],[0,0,1,0],[0,0,0,1]]);
> display([seq(polygonplot3d(polydecode(perspproj(multpoly(hypercube,M),[1,0,0,0],3)),style=wireframe,thickness=3),i=1..15)],insequence=true, scaling=constrained);
![[Maple Plot]](images/haneyhypercube6.gif)
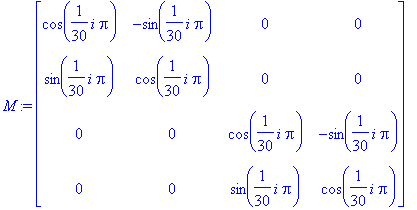
Here is another rotation matrix which produces a fascinating image, my personal favorite. It show the same image above, with the whole projection rotating on its own axis. The reason of this is that the projection vector lies in one of the planes of rotation. The line orthogonal to it is the axis of rotation in 3-space.
>
i:='i':t:=i*Pi/30:
M:=array([[cos(t),-sin(t),0,0],[sin(t),cos(t),0,0],[0,0,cos(t),-sin(t)],[0,0,sin(t),cos(t)]]);
> display([seq(polygonplot3d(polydecode(perspproj(multpoly(hypercube,M),[1,0,0,0],3)),style=wireframe,thickness=3),i=1..15)],insequence=true, scaling=constrained);
![[Maple Plot]](images/haneyhypercube8.gif)
>