Section 1.5: Pages 63 – 64
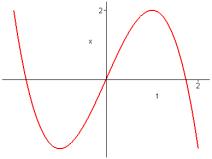
6. Graph the given functions on a common screen. How are these graphs related?
![]() ,
, ![]() ,
,![]() ,
,![]() ,
,
![]()
![]()
![]()
![]()
![]()
![]()
![]()
![]()
15. Find the exponential function ![]() whose graph is given.
whose graph is given.
x

We will
plug the given points into the formula for the function.
![]()
Now, all we need do is to solve for C and a.

and, thus, ![]() . Thus the function
is
. Thus the function
is ![]() .
.
16. Find the exponential function ![]() whose graph is given.
whose graph is given.


We do the
same as above. Plug the given points
into the formula for the function.

Now, all we need do is to solve for C and a.

Thus the function is ![]() .
.
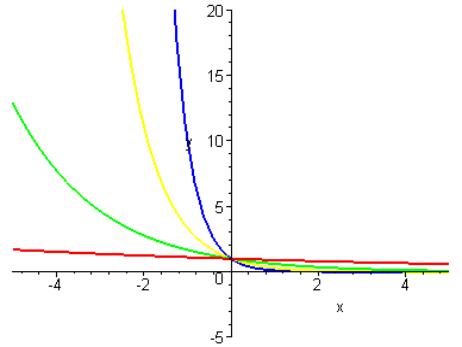
20. Compare the functions ![]() and
and ![]() by graphing both
functions in several viewing rectangles. Find all point of intersection of the
graphs correct to one decimal
by graphing both
functions in several viewing rectangles. Find all point of intersection of the
graphs correct to one decimal  place.
Which function grows more rapidly when x is large?
place.
Which function grows more rapidly when x is large?
The
red graph is the graph of ![]() , while the green graph is the graph of
, while the green graph is the graph of ![]() . We see that the
graphs must cross at about 20.
Recalling, though, that the exponential function grows faster than any
power of x, we should expect another intersection. Use the calculator and find that
. We see that the
graphs must cross at about 20.
Recalling, though, that the exponential function grows faster than any
power of x, we should expect another intersection. Use the calculator and find that ![]() and
and ![]() . What about another
point of intersection? Sure enough we
find a point of intersection at
. What about another
point of intersection? Sure enough we
find a point of intersection at ![]() and
and ![]() . We already know
that the exponential function
. We already know
that the exponential function ![]() grows more rapidly for x large.
grows more rapidly for x large.
24. An isotope of sodium, 24Na, has a half-life of 15 hours. A sample of this isotope has mass 2 g.
(a) Find the amount remaining after 60 hours.
After
15 hours, ½ is left (or 1 g). After 15
more hours ½ of that is left, or ½ g.
After 15 more hours ½ of that is left, or ¼ g. After 15 more hours (which is after 60 hours) we have ½ of that
left, or 1/8 g.
(b) Find the amount remaining after t hours.
![]()
(c) Estimate the amount remaining after 4 days.
After 4 days, ![]() and the amount
remaining is
and the amount
remaining is ![]() g
g
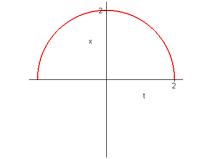
(d) Use a graph to estimate the time required for the mass to be reduced to 0.01 g.
 We want to find the point of intersection of the
graph of our function and the horizontal line
We want to find the point of intersection of the
graph of our function and the horizontal line ![]() .
.
Set your calculator window so that
Xmin = 50
Xmax = 150
Ymin = 0
Ymax = 0.2
You
should get a graph like the above. Now,
find the point of intersection. This is
![]() hours — 4 days, 18
hours, 39 minutes and 28 seconds.
hours — 4 days, 18
hours, 39 minutes and 28 seconds.