An Illustration of Basic Probability: The Normal Distribution |
|---|
The exhibit below illustrates a simple process that gives rise to the familiar "bell curve" of the normal distribution. In this case balls are dropped from the top and pass through a series of pins until they hit the bottom. Once at the bottom, they stack up to record the number that have hit that point. At first there does not seem to be any pattern but after a few minutes the stacks conform to the superimposed curve.
This idea of illustration goes back to Sir Galton. Why it works? Well, the final position of each ball is determined by many (here only 8) independent, random events of whether to drop to the left or the right of the pin, thus the (approximate) normal distribution.
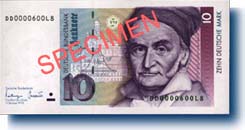
The German Money --- 10 Mark note has Karl F. Gauss printed on the back, and
a small bell shaped curve and its math formula in the background,
below the letter C.