Section 2.3 Functions as Graphs and Tables
Subsection 2.3.1 Functions as Graphs
A graph is a visual way of representing a function. The \(x\)-values represent the inputs and the \(y\)-values represent the outputs. So, for example, if the point \((2,7)\) is somewhere on the graph, that means that \(f(2)=7\text{.}\) This gives us our strategy for evaluating functions given as graphs, which is demonstrated in the example below:
Example 2.12.
Suppose \(g(x)\) is given in the graph below:
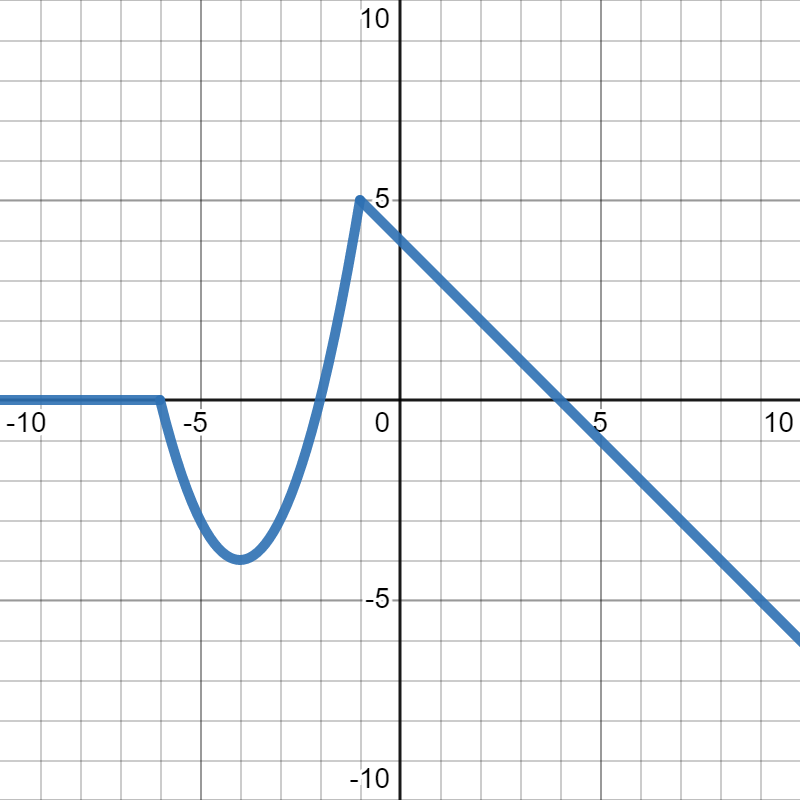
Now, suppose we want to find \(g(-1)\text{.}\) We know that \(-1\) is our input, which is represented by the \(x\)-values on the graph. So, we move along the \(x\)-axis to where \(x=-1\text{.}\) Then, we look up and down at that \(x\)-value to see where the graph crosses it. Moving up, we see that the point \((-1,5)\) is on the graph. Since the \(y\)-values represent the outputs, that tells us that \(g(-1)=5\text{.}\)
Checkpoint 2.13.
Suppose \(g(x)\) is given in the graph below:
Evaluate each of the following:
\(\displaystyle g(0)\)
\(\displaystyle g(3)\)
\(\displaystyle g(-4)\)
\(\displaystyle g(-8)\)
\(\displaystyle g(0)=4\)
\(\displaystyle g(3)=1\)
\(\displaystyle g(-4)=-4\)
\(\displaystyle g(-8)=0\)
Suppose \(g(x)\) is given in the graph below:
Evaluate each of the following:
To find \(g(0)\text{,}\) we know that \(0\) is our input, which is represented by the \(x\)-values on the graph. So, we move along the \(x\)-axis to where \(x=0\text{.}\) Then, we look up and down at that \(x\)-value to see where the graph crosses it. Moving up, we see that the point \((0,4)\) is on the graph. Since the \(y\)-values represent the outputs, that tells us that \(g(0)=4\text{.}\)
To find \(g(3)\text{,}\) we know that \(3\) is our input, which is represented by the \(x\)-values on the graph. So, we move along the \(x\)-axis to where \(x=3\text{.}\) Then, we look up and down at that \(x\)-value to see where the graph crosses it. Moving up, we see that the point \((3,1)\) is on the graph. Since the \(y\)-values represent the outputs, that tells us that \(g(3)=1\text{.}\)
To find \(g(-4)\text{,}\) we know that \(-4\) is our input, which is represented by the \(x\)-values on the graph. So, we move along the \(x\)-axis to where \(x=-4\text{.}\) Then, we look up and down at that \(x\)-value to see where the graph crosses it. Moving down, we see that the point \((-4,-4)\) is on the graph. Since the \(y\)-values represent the outputs, that tells us that \(g(-4)=-4\text{.}\)
To find \(g(-8)\text{,}\) we know that \(-8\) is our input, which is represented by the \(x\)-values on the graph. So, we move along the \(x\)-axis to where \(x=-8\text{.}\) Then, we look up and down at that \(x\)-value to see where the graph crosses it. In this case, we actually don't need to move at all to see that the point \((-8,0)\) is on the graph. Since the \(y\)-values represent the outputs, that tells us that \(g(-8)=0\text{.}\)
In the last section, we looked at piecewise functions as formulas. We can also have graphs of piecewise functions. We follow the same steps as we do for reading any other graph, but we have to be extra careful at the part of the graph where it breaks. The graph has to tell you whether it is including the endpoint itself or if it is not including the endpoint, just everything up to it.
A closed dot is a filled in dot, and it indicates that that point is included on the graph
An open dot is not filled in, and it indicates that that point is not included on the graph
Example 2.14.
Suppose \(f(x)\) is given in the graph below:
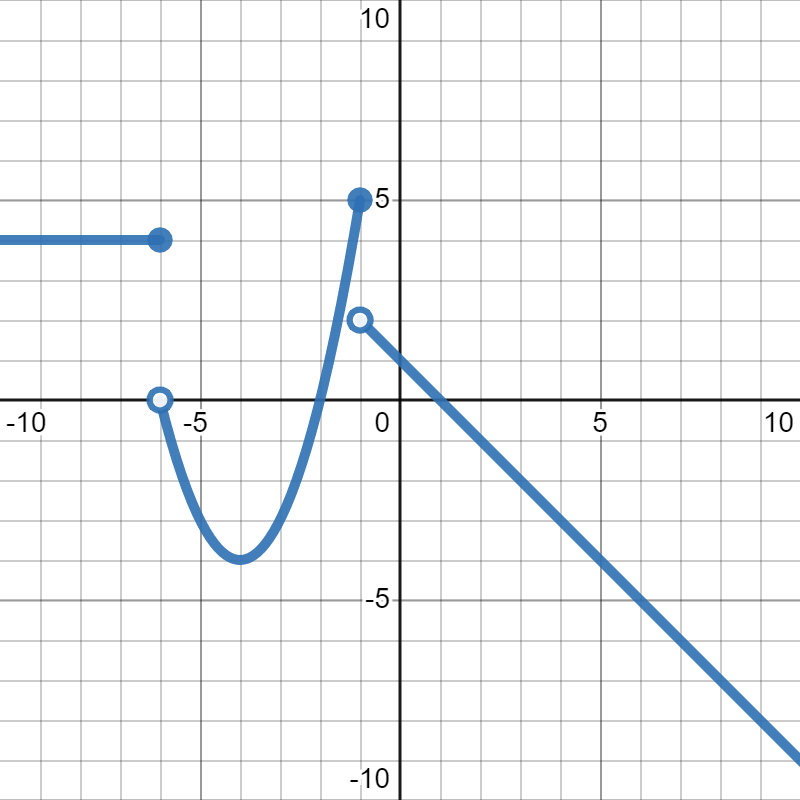
Now, suppose we want to find \(f(-1)\text{.}\) We know that \(-1\) is our input, which is represented by the \(x\)-values on the graph. So, we move along the \(x\)-axis to where \(x=-1\text{.}\) Then, we look up and down at that \(x\)-value to see where the graph crosses it. Moving up, we actually see two points: \((-1,5)\) and \((-1,2)\text{.}\) However, the point at \((-1,2)\) is not filled in, so it isn't included in the graph, and we can ignore it. Since the point at \((-1,5)\) is filled in, it is included in our graph. So, that point gives us our answer of \(f(-1)=5\text{.}\)
Checkpoint 2.15.
Suppose \(f(x)\) is given in the graph below:
Evaluate each of the following:
\(\displaystyle f(-6)\)
\(\displaystyle f(-3)\)
\(\displaystyle f(-6)=4\)
\(\displaystyle f(-3)=-3\)
Suppose \(f(x)\) is given in the graph below:
Evaluate each of the following:
To find \(f(-6)\text{,}\) we know that \(-6\) is our input, which is represented by the \(x\)-values on the graph. So, we move along the \(x\)-axis to where \(x=-6\text{.}\) Then, we look up and down at that \(x\)-value to see where the graph crosses it. Moving up, we actually see two points: \((-6,0)\) and \((-6,4)\text{.}\) However, the point at \((-6,0)\) is an open circle, so it isn't included in the graph, and we can ignore it. Since the point at \((-6,4)\) is closed, it is included in our graph. So, that point gives us our answer of \(f(-6)=4\text{.}\)
To find \(f(-3)\text{,}\) we know that \(-3\) is our input, which is represented by the \(x\)-values on the graph. So, we move along the \(x\)-axis to where \(x=-3\text{.}\) Then, we look up and down at that \(x\)-value to see where the graph crosses it. This one only has one point, like the ones we looked at before. Since \((-3,-3)\) is the only point there, that gives us our answer of \(f(-3)=-3\text{.}\)
Subsection 2.3.2 Functions as Tables
Sometimes, we don't have a nice formula or graph that tells us about all of the values of a function. Instead, we might only know a few values. In that case, writing it as a table is a good option. In this case, the table will have a column for the inputs, labeled with an \(x\text{,}\) and a column for the outputs, labeled with the name of the function like \(f(x)\text{.}\)
Example 2.16.
Suppose \(f(x)\) is given in the table below:
| \(x\) | \(f(x)\) |
| \(-3\) | \(0\) |
| \(2\) | \(2\) |
| \(1.5\) | \(-5\) |
| \(\pi\) | \(3.14\) |
| \(\frac{17}{3}\) | \(1.7\) |
Now, suppose we want to evaluate \(f(1.5)\text{.}\) Since \(1.5\) is our input, we look for \(1.5\) in the input column, which we know is the first column because that's the one labeled with the \(x\text{.}\) We see that \(1.5\) in the third row of numbers. So, we look in the output column (the second column, lableled with the \(f(x)\)) in the third row of numbers to get our answer: \(f(1.5)=-5\text{.}\)
Sometimes, there will be more than one function in the same table. In that case, there will still be one input column labled with an \(x\text{,}\) but then to find the output, you look at the column labeled with the name of the function you want to evaluate.
Example 2.18.
Suppose \(f(x)\text{,}\) \(g(x)\text{,}\) and \(h(x)\) are represented in the table below:
| \(x\) | \(f(x)\) | \(g(x)\) | \(h(x)\) |
| \(-1\) | \(5\) | \(1\) | \(6\) |
| \(0\) | \(5\) | \(-7\) | \(6\) |
| \(2\) | \(-5\) | \(4\) | \(9\) |
| \(5\) | \(3\) | \(5\) | \(3\) |
| \(7\) | \(1\) | \(-7\) | \(0\) |
We want to evaluate \(g(0)\text{.}\) Since \(0\) is our input, we look for \(0\) in the input column, which we know is the first column because that's the one labeled with the \(x\text{.}\) We see that \(0\) in the second row of numbers. So, we look in the output column for \(g(x)\) (the third column, lableled with the \(g(x)\)) in the second row of numbers to get our answer: \(g(0)=-7\text{.}\)
Checkpoint 2.20.
Suppose \(f(x)\text{,}\) \(g(x)\text{,}\) and \(h(x)\) are represented in the table below:
| \(x\) | \(f(x)\) | \(g(x)\) | \(h(x)\) |
| \(-1\) | \(5\) | \(1\) | \(6\) |
| \(0\) | \(5\) | \(-7\) | \(6\) |
| \(2\) | \(-5\) | \(4\) | \(9\) |
| \(5\) | \(3\) | \(5\) | \(3\) |
| \(7\) | \(1\) | \(-7\) | \(0\) |
Evaluate each of the following:
\(\displaystyle f(-1)\)
\(\displaystyle g(7)\)
\(\displaystyle h(2)\)
Evaluate each of the following:
\(\displaystyle f(-1) = 5\)
\(\displaystyle g(7) = -7\)
\(\displaystyle h(2) = 9\)
Evaluate each of the following:
To find \(f(-1)\text{,}\) we know that \(-1\) is our input, so we look for \(-1\) in the input column, which we know is the first column because that's the one labeled with the \(x\text{.}\) We see that \(-1\) in the first row of numbers. So, we look in the output column for \(f(x)\) (the second column, lableled with the \(f(x)\)) in the first row of numbers to get our answer: \(f(-1) = 5\text{.}\)
To find \(g(7)\text{,}\) we know that \(7\) is our input, so we look for \(7\) in the input column, which we know is the first column because that's the one labeled with the \(x\text{.}\) We see that \(7\) in the last row of numbers. So, we look in the output column for \(g(x)\) (the third column, lableled with the \(g(x)\)) in the last row of numbers to get our answer: \(g(7) = -7\text{.}\)
To find \(h(2)\text{,}\) we know that \(2\) is our input, so we look for \(2\) in the input column, which we know is the first column because that's the one labeled with the \(x\text{.}\) We see that \(2\) in the third row of numbers. So, we look in the output column for \(h(x)\) (the fourth column, lableled with the \(h(x)\)) in the third row of numbers to get our answer: \(h(2) = 9\text{.}\)
Example 2.22. Horizontal Tables.
Sometimes, we have tables laid out in rows rather than in columns. You can tell based on where the labels are. If it's a table in rows, you'll have an input row and an output row, rather than an input column and an output column. For example, suppose \(p(x)\) is given in the table below:
| \(x\) | \(-5\) | \(-2\) | \(1\) | \(2\) | \(3\) |
| \(p(x)\) | \(2\) | \(3\) | \(4\) | \(1\) | \(1\) |
Suppose we want to find \(p(3)\text{.}\) Since \(3\) is our input, we look for \(3\) in the input row, which we know is the first row because that's the one labeled with the \(x\text{.}\) We see that \(3\) in the last column of numbers. So, we look in the output row for \(p(x)\) (the second row, lableled with the \(p(x)\)) in the last column of numbers to get our answer: \(p(3) = 1\text{.}\)