Section 3.3 Range from a Graph
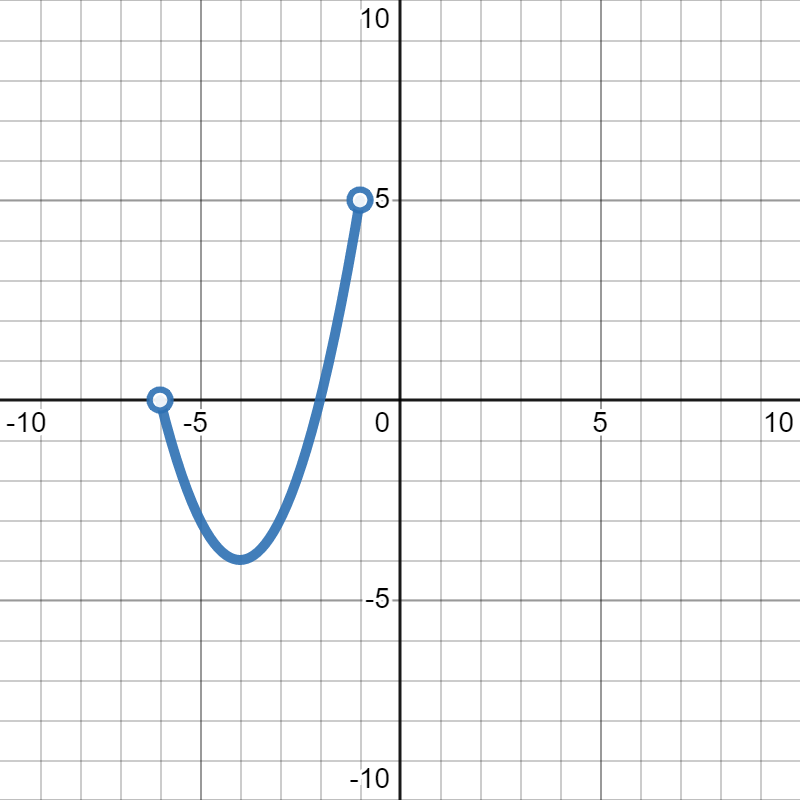
Let's start with a warm-up question. Suppose \(f(x)\) is given in the graph below.
Now, let's say we want to solve the following equations:
\(\displaystyle f(x)=5\)
\(\displaystyle f(x)=1\)
\(\displaystyle f(x)=6\)
For each of these questions, the number given is the output, which is the \(y\)-value. We then use the graph to find all of the \(x\)-values that correspond to it. So, to solve \(f(x)=5\text{,}\) we go to where \(y=5\) and we see that the corresponding point on the graph is at \((4,5)\text{.}\) That means that \(f(4)=5\text{,}\) so the solution to the first equation is \(x=4\text{.}\) For the second one, we find two points on the graph where \(y=1\text{:}\) \((1,1)\) and \((6,1)\text{.}\) That means that \(f(1)=1\) and \(f(6)=1\text{.}\) So, there are two solutions to the second question: \(x=1,6\text{.}\) However, for the third question, we can see that the graph does not cross \(y=6\text{.}\) So, there is no solution to \(f(x)=6\text{,}\) since \(6\) is not an output to this function.
In the warm-up example above, the first two outputs were included in the graph, but the third input wasn't included. In this section, we want to figure out what are all the possible outputs to a function as a graph.
Definition 3.17.
The range of a function is the set of all possible outputs.
Remember that when we are looking at a graph of a function, the outputs are the \(y\)-values. So, when we are finding the range of a graph, we are looking for all of the \(y\)-values that get overed on the graph. There are two metaphors you might find helpful.
Imagine rain going sideways from the graph to the \(y\)-axis.
Imagine putting your hands on the sides of the graph and squishing it onto the \(y\)-axis.
In either case, the endpoints slide to the \(y\)-axis with the same type (open stays open and closed stays closed). Don't forget to write your final answer in interval notation. See the two examples below for an animation of each metaphor and decide which one makes more sense to you.
Example 3.18.
Click on "Rain" or "Squish" in the graph below to watch the animation for finding the range. From the animation, you'll see that the range of this function is \([-5,4)\text{.}\) If you want to see the animation in a larger window, click here 5 .
Checkpoint 3.19.
Find the range of the function in the graph below:
\([-4,-2)\cup(1,6]\)
First, we look for all of the \(y\)-values that get covered by the graph. We see that the part on the left starts at \(y=1\) and ends at \(y=6\text{,}\) so that will be our first interval. Since the dot at \((-6,1)\) is an open dot, it is not included in the graph, so we need a round parentheses \((\) at the \(y=1\) endpoint of our interval notation. Since the dot at \((-1,6)\) is a closed dot, it is included in the graph, so we need a square bracket \(]\) at the \(y=6\) end of our interval, giving us \((1,6]\) for our first piece.
For the piece on the right, we see that the graph goes from \(y=-4\) to \(y=-2\text{.}\) Since the endpoint at \((2,-4)\) is closed, it gets a square bracket ]. The endpoint at \((6,-2)\) is open, so it gets a round parentheses ). This gives us \([-4,-2)\) for our other interval.
To put the two intervals together, we use a union. So, our final answer is \([-4,-2)\cup(1,6]\)
Just like with domains, we need to be careful when there is more than one piece, in case there is any overlap. However, with the range, there can be more overlap, so it can be more difficult. The key is that we don't care how often a \(y\)-value is covered by the graph. If it covered somewhere, then it is in the range, period.
Example 3.20.
Click on "Rain" or "Squish" in the graph below to watch the animation for finding the range. From the animation, you'll see that the range of this function is \((-3,4)\text{.}\) If you want to see the animation in a larger window, click here 6 .
Example 3.21.
Click on "Rain" or "Squish" in the graph below to watch the animation for finding the range. From the animation, you'll see that the range of this function is \((-3,4)\text{.}\) If you want to see the animation in a larger window, click here 7 .
Checkpoint 3.22.
Find the range of the function in the graph below:
\([-6,5]\)
First, we look for all of the \(y\)-values that get covered by the graph. We see that the part on the left starts at \(y=-4\) and ends at \(y=5\text{,}\) including both endpoints. So, we have \([-4,5]\) for our first piece.
For the piece on the right, we see that the graph goes from \(y=-6\) to \(y=-4\text{,}\) only including the first endpoint. This gives us \([-6,-4)\) for our other interval.
To put the two intervals together, we use a union. However, when we look carefully at the graph and at our intervals, they overlap at \(y=-4\text{.}\) Since that is included in the first part of the graph, it is included in the range. So, our final answer is just one long interval: \([-6,5]\)
Checkpoint 3.23.
Find the range of the function in the graph below:
\([-6,5)\)
Remember: we want to look for all of the \(y\)-values that get covered by the graph. This one has a lot of overlap, so it is probably easiest to solve by shading in the picture.
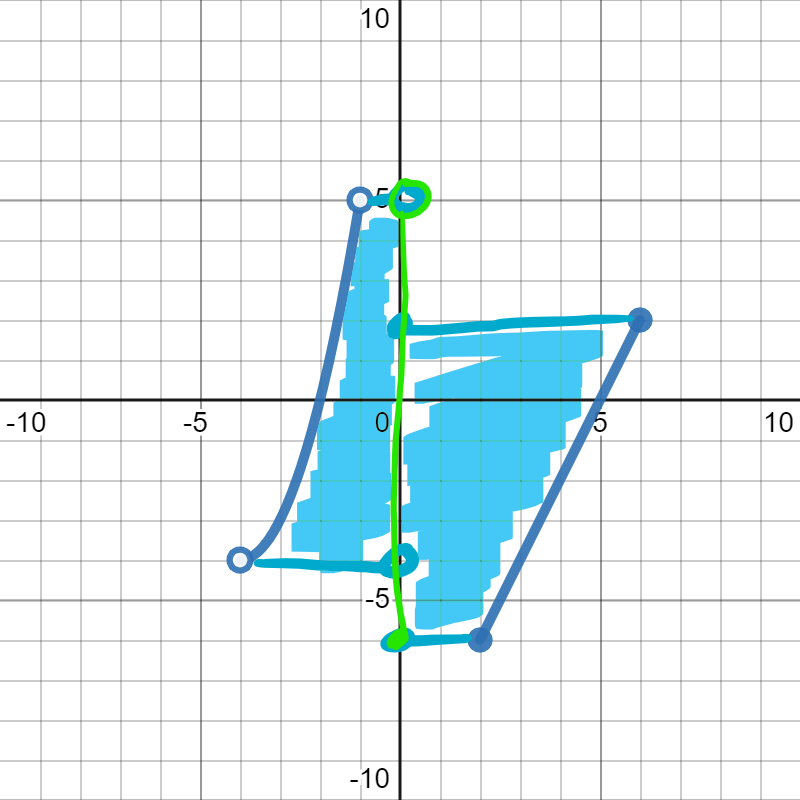
Because of the overlap of the two pieces, we end up with one interval for our range: \([-6,5)\)
It is very tempting to think that \(y=-4\) is not included in the range because of the open circle at \((-4,-4)\text{.}\) While it is true that it is not included at that point, it is included on the graph at \((3,-4)\text{.}\) The range is everything that is included somewhere on the graph. So, the fact that the point \((-4,-4)\) is not included ends up not mattering because the point \((3,-4)\) is included, so \(y=-4\) is included somewhere, and therefore is included in the range.
One other weird thing you can run into with the range is in the example below. Sometimes, the graph will turn, and your endpoint of your range will be in the middle of the curve, rather than at an endpoint. Although there is not an extra point there, every part of the curve of the graph is included. Therefore, the default is that it will be included, unless there is an open circle specifically placed there. See the example below for an animation of this situation.
Example 3.24.
Click on "Rain" or "Squish" in the graph below to watch the animation for finding the range. From the animation, you'll see that the range of this function is \([-3,5]\text{.}\) If you want to see the animation in a larger window, click here 8 .
Checkpoint 3.25.
Find the range of the function in the graph below:
\([-4,5)\)
Remember: we want to look for all of the \(y\)-values that get covered by the graph. This one has a lot of overlap, so it is probably easiest to solve by shading in the picture.
Because of the overlap of the two pieces, we end up with one interval for our range: \([-4,5)\)
It is very tempting to think that \(y=-4\) is not included in the range because there is no closed circle there. However, the point \((-4,-4)\) is on the curve of the graph, so it is included by default. That is why we have a square bracket for \(y=-4\text{.}\) We would only not include \(y=-4\) in the range if there was an extra open circle at \((-4,-4)\)
https://www.desmos.com/calculator/ivjipw4mw8https://www.desmos.com/calculator/gq88tq7jayhttps://www.desmos.com/calculator/a9769qd2crhttps://www.desmos.com/calculator/xw5fsqwdd6